![月刊地域医学WEB版[MONTHLY COMMUNITY MEDICINE]](https://chiiki-igaku.jp/wp-content/uploads/2026/05/logo_chiiki.png)
Masayuki Domichi1, Hiroshi Okada2, Akiko Suganuma1, Naoki Sakane1
1Division of Preventive Medicine, Clinical Research Institute, National Hospital Organization Kyoto Medical Center, Kyoto Japan
2Department of Preventive Services, Kyoto University School of Public Health, Kyoto, Japan
Corresponding author: Naoki Sakane, MD, PhD (nsakane@gf6.so-net.ne.jp)
Division of Preventive Medicine, Clinical Research Institute, National Hospital Organization Kyoto Medical Center, 1-1 Mukaihata-cho, Fukakusa, Fushimi-ku, Kyoto 612-8555, Japan
Received 2026 Apr 23/Accepted 2026 Jun 26
Abstract
Aim/Introduction: Integrating physiological data from continuous glucose monitoring (CGM) with real-world behavioral data may offer new insights into health management. This study examined longitudinal changes in CGM-derived glycemic metrics and characterized patterns in participant-generated communication using a social networking platform.
Patients and Methods: Seven participants (five females, two males; mean age 60.0 ± 4.4 years) using the FreeStyle Libre 2 CGM system and LINE were included. CGM metrics were compared between early (days 2–7) and later (days 8–15) periods. Text data were analyzed for need categories, sentiment (positive, neutral, negative), temporal patterns, and interaction networks. Paired t-tests with Cohen’s d were used for comparisons, and Spearman’s rank correlation assessed associations.
Results: All seven participants were analyzed in both periods. Mean glucose management indicator (GMI) was 6.1% (SD 0.2), and none had diabetes. CGM metrics showed no significant differences between periods, although hAUC and MODD tended to decrease. Total word count was not associated with glycemic metrics. However, the proportion of positive words was negatively correlated with changes in mean glucose (r = −0.809, P = 0.028), while neutral words showed a borderline positive association. Text analysis revealed that a limited number of need categories accounted for most posts, with activity peaking in the evening and on weekends. Network analysis indicated that a few participants played central roles in communication.
Conclusions: While glycemic control remained stable, communication data revealed distinct behavioral patterns. Integrating physiological and digital behavioral data may improve understanding of engagement and support personalized management strategies.
Keywords: Continuous glucose monitoring, Digital health, Sentiment analysis, Patient engagement, Social media analysis
Introduction
CGM-derived metrics provide clinically useful insights into glycemic control and are associated with reduced risk of complications and improved quality of life 1). In Japan, LINE is widely used as a communication platform. Analysis of participant-generated text data may provide insights into users’ needs, emotional states, and engagement patterns, and social networking platforms have been reported to support health behavior change and user engagement 2). Integrating such behavioral data with physiological data such as CGM may contribute to a more comprehensive understanding of patient-centered outcomes 3). This study aimed to analyze CGM-derived metrics and participant-generated text data to provide insights into improving diabetes management.
Patients and Methods
This analysis was conducted as part of a screening assessment using the FreeStyle Libre 2 CGM system. Seven participants (five females and two males; mean age 60.0 ± 4.4 years) who were active LINE users were included.
CGM data were obtained using the FreeStyle Libre 2 system. Glycemic metrics were calculated across two predefined study periods. For each participant, standard CGM-derived indices were determined, including GMI, mean glucose, standard deviation (SD), coefficient of variation (%CV), time above range (TAR), TIR, time below range (TBR), area under the curve (AUC), hyperglycemic AUC (hAUC), hypoglycemic AUC (lAUC), mean amplitude of glycemic excursions (MAGE), and mean of daily differences (MODD).
CGM metrics were calculated for two periods: early (days 2–7) and later (days 8–15). GMI was estimated from mean glucose as GMI (%) = 3.31 + 0.02392 × mean glucose (mg/dL), excluding day 1, and categorized as ≥6.5% (diabetes) and 5.7–6.4% (prediabetes). Continuous variables are presented as mean ± SD. Differences between periods were assessed using paired t-tests with effect sizes (Cohen’s d).
Text data were categorized into predefined need-based categories, and category frequencies were calculated to assess heterogeneity. Posts were classified as positive, neutral, or negative based on lexical features, and temporal patterns were analyzed by month, hour, and day of the week.
Network analysis of participant interactions defined posts within a 30-minute window as temporally associated. Nodes represented participants, and edges reflected the frequency of co-occurrence of posts.
Analyses were performed using R (version 4.1.2).
Results
CGM metrics showed no significant differences between periods, though hAUC and MODD exhibited moderate reductions (Table 1). Word proportion analysis revealed that positive word usage was significantly negatively correlated with mean glucose changes (r = -0.809, P = 0.028). Neutral words showed a borderline positive correlation, while negative words showed no significant association (Table 2).
Needs categories were heterogeneous; communication, photos, and eating habits were the most frequent. Sentiment was predominantly neutral (71.3%), followed by positive (18.6%) and negative (10.2%). Posting activity followed a clear diurnal pattern, peaking in the evening, with higher frequency on weekends (Figure 1). Participation was uneven, with a few central participants acting as hubs in the interaction network (Figure 2).
Table 1. Comparison of continuous glucose monitoring (CGM) metrics between the early and later periods
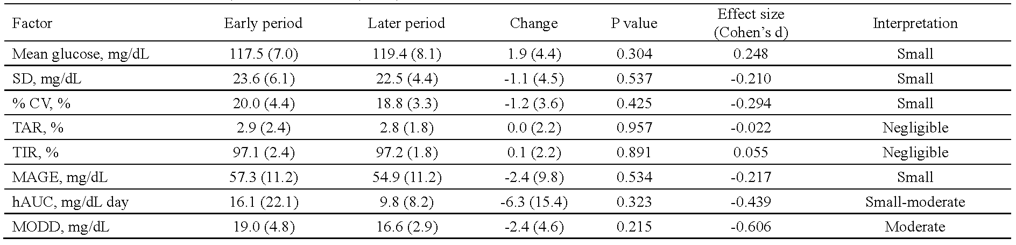
Data are mean (SD). Effect sizes (Cohen’s d) are: negligible (<0.2), small (0.2–0.49), moderate (0.5–0.79), and large (≥0.8); negative values indicate reduction. TBR effect size was excluded due to a floor effect/lack of variability.
Abbreviations: CGM, continuous glucose monitoring; SD, standard deviation; CV, coefficient of variation; TAR, >180 mg/dL; TIR, 70–180 mg/dL; TBR, <70 mg/dL; MAGE, mean amplitude of glycemic excursions; hAUC, hyperglycemic area under the curve; MODD, mean of daily differences.
Table 2. Correlations between sentiment-related word metrics and glycemic measures (mean glucose and hyperglycemic area under the curve derived from LINE messages
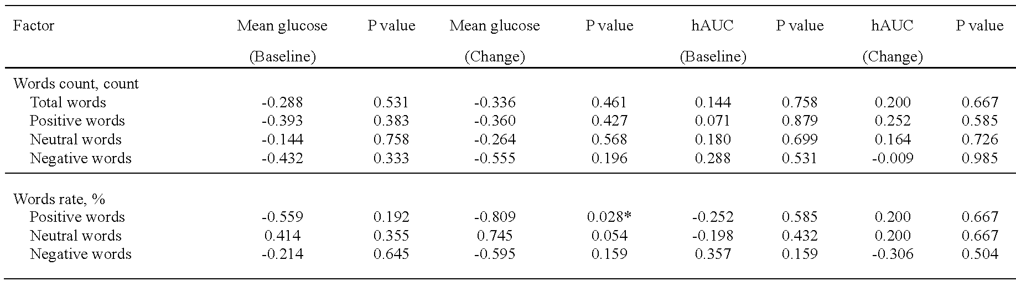
Data are correlation coefficients. *P < 0.05.
“Mean” denotes early period average; “Change” denotes difference between early and later periods.
Abbreviation: hAUC, hyperglycemic area under the curve.
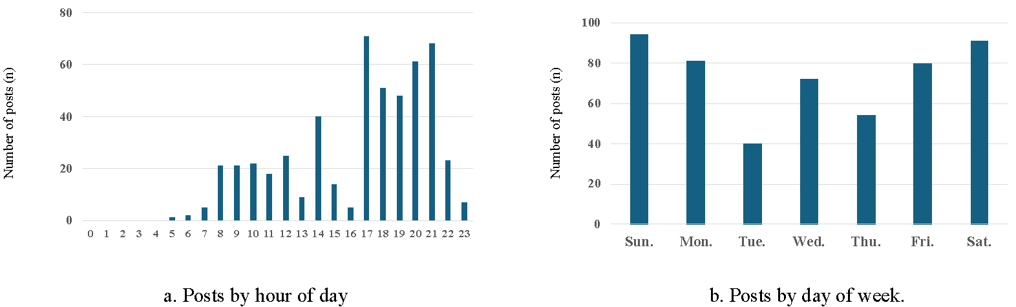
Figure 1. Temporal distribution of posts.
(a) Distribution of posts by hour of the day, illustrating temporal variations in posting activity.
(b) Distribution of posts by day of the week, indicating weekly patterns in posting frequency.
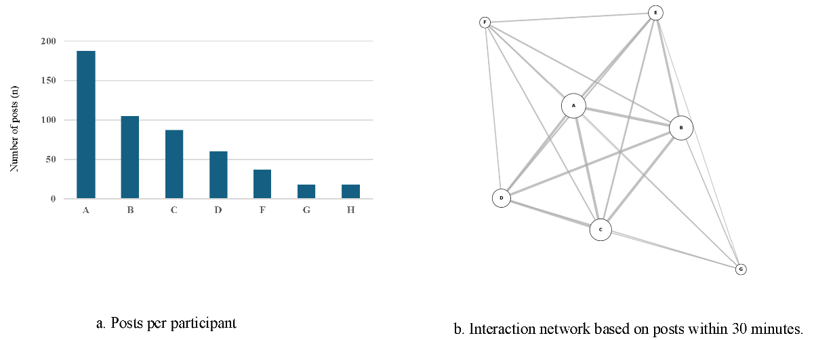
Figure 2. Participant posting activity and interaction network.
(a) Number of posts per participant, showing individual variability in contribution.
(b) Temporal interaction network (30-min window).
Nodes represent participants; edges indicate temporal co-occurrence, with thickness reflecting association strength.
Discussion
The decrease in hAUC and MODD suggests improved postprandial control and reduced variability, despite stable mean glucose. The link between positive language and glucose trends suggests that communication patterns may reflect metabolic shifts. Our findings align with social media-based intervention studies [4]. Evening and weekend engagement peaks indicate higher user acceptability, requiring further validation for glycemic outcomes. The identified central participants could serve as informal facilitators to boost peer engagement. Lack of direct CGM-communication correlation likely stems from the small sample size (n=7) and stable baseline control. Clinically, integrating CGM and LINE data offers a holistic view of patient needs and emotional states. Future research should evaluate assertive communication programs to enhance self-management.
Acknowledgments
We thank the participants and staff for their contributions to this study.
Use of Generative AI: Generative AI was used for language editing.
Ethics and Disclosure:
- COI: No conflicts of interest.
- Ethics: This study followed the Declaration of Helsinki and was approved by the Ethics Review Committee of the Japan Community Pharmacy Association (No. 202601).
References
1) Friedman JG, Coyne K, Aleppo G, et al: Beyond A1C: exploring continuous glucose monitoring metrics in managing diabetes. Endocr Connect 2023; 12: e230085.
2) Yang Q: Are social networking sites making health behavior change interventions more effective? A meta-analytic review. J Health Commun 2017; 22: 223-233.
3) Laranjo L, Arguel A, Neves AL, et al: The influence of social networking sites on health behavior change: a systematic review and meta-analysis. J Am Med Inform Assoc 2015; 22: 243-256.
4) Kumbara AB, Iyer AK, Green CR, et al: Impact of a combined continuous glucose monitoring-digital health solution on glucose metrics and self-management behavior for adults with type 2 diabetes: real-world, observational study. JMIR Diabetes 2023; 8: e47638.